
In what I hope will be my final PhD coursework assignment, I was recently required to collect a set of data, and then analyse it using MATLAB, a multi-paradigm numerical computing software used by computer programmers, and biomechanics students like me.
Naturally, I decided to collect some data on soccer.
My rationale for choosing the data I collected – and the eventual analysis I conducted – was to try to help answer a question that has been on my mind for a long time now:
What exactly is the best way to predict the performance of national soccer teams in international competitions, like the FIFA World Cup?
Below is a summary of the study I conducted to help me find the answer to this question.
Introduction: Predicting Success in International Soccer
In international soccer, the success of each country’s national team can be measured using the FIFA/Coca Cola World Ranking, which assigns points to each national team from every match they play, based on whether the match was won or drawn, the relative importance of the match, the strength of the opponent in terms of ranking position, and what conference their opponent belonged to.
When evaluating the relative success of one national team versus another, however, there are many factors which must be considered to make fair and equitable comparisons.
In a recent article published in The Economist (“By their bootstraps”, 2018), the authors identified three main factors which can be used to predict the success of national teams: population, gross domestic product or “GDP” and “participation rate” – calculated as the ratio of number of registered soccer players in a country versus the population of the country.
In that article, each of these three variables were shown to be positively correlated to a country’s success, which was assessed not by the FIFA/Coca Cola World Ranking, but rather via “goal difference” – the difference between the number of goals scored and the number of goals conceded – in a calendar year.
To date, there have not been any studies examining the relationship between countries’ population, GDP, and participation rate, with international soccer success as measured by the FIFA/Coca Cola World Ranking, and thus the aim of my study was to examine the correlations amongst these variables in all FIFA member countries.
Methods: How the Study Was Done (Plus an Introduction to Linear Regression Analysis)
FIFA/Coca Cola World Ranking (termed “FWR” for short) was determined for all 207 FIFA member countries for July 2018, the month and year in which this study was completed (www.fifa.com).
The total number of registered players in each country (termed “NP”), attained via a FIFA worldwide survey (FIFA, 2006), and the population of each country (termed “CP”), attained via www.wikipedia.com, were then used to determine the percentage of the total population of each country who are registered soccer players (participation rate, PR). PR was expressed as a percentage, by dividing NP by CP.
Gross domestic product (termed “GDP”) for each country, for the 2017 calendar year, was determined via internet search on an economics website (www.tradingeconomics.com, 2018).
Correlations between each of the three variables (CP, PR, and GDP) and FWR were developed by using univariate linear regression analyses in MATLAB software version R2016a (MATLAB, 2016).
What exactly is a linear regression analysis?
In short, it is an analysis in which a single independent variable (for example, CP, PR, or GDP) is used to predict the value of a dependent variable (for example, FWR).
The result of a linear regression is an value, which is a statistical measure of how close the data are to the fitted regression line. An value of 1.0 indicates that the model explains 100% of the variability of the data around its mean, so the greater the value, the greater the predictive value of the particular variable.
For my study, I examined the relationship of each individual variable (CP, PR, and GDP) with FWR, and then each possible combination of variables (CP with PR, CP with GDP, etc..you get the picture) with FWR, to see which variable or combination of variables had the highest correlation to each country’s FWR score.
Results: What I Found Out
Below is a figure displaying the (“RSQ”) value for each individual variable, and each combination of variables, with the FIFA / Coca Cola World Ranking.
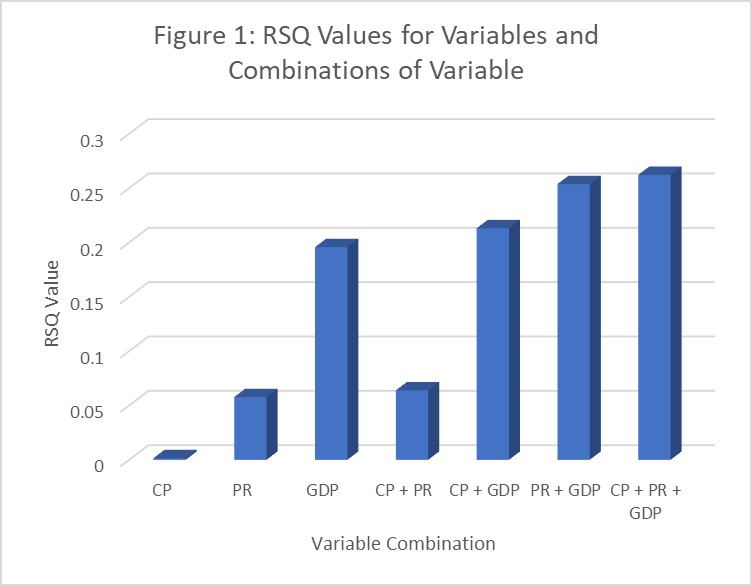
Based on my analysis, GDP had by far the highest value, at 0.1957. This means that approximately 20% of the variance in countries’ FIFA/Coca Cola World Ranking (FWR) scores can be accounted for by their gross domestic product.
The variable with the second highest value was PR, at 0.0577, so approximately 5% of the variance in countries’ FWR scores can be accounted for by their participation ratio.
CP had the lowest value at just 0.0015, so approximately 1% of the variance in countries’ FWR can be accounted for by their population.
When combining variables and examining the combinations of variables, the (RSQ) value became higher than it had been with any individual variable. CP and PR had an value of 0.0639, CP and GDP had an value of 0.2131, PR and GDP had an value of 0.2537, and the combination of CP, PR, and GDP had an value of 0.2622.
Thus, the combination of population, participation rate, and gross domestic product together accounted for approximately 26% of the variance in countries’ FIFA/Coca Cola World Ranking scores.
Discussion and Conclusions: What Does This All Mean?
Gross domestic product (GDP) was by far the best predictor of performance in the FIFA/Coca Cola World Rankings, accounting for almost 20% of the variance in countries’ scores. Thus, countries with stronger and more productive economies are much more likely to have success in international soccer than those with weaker/less productive economies.
Perhaps, governments of countries wishing to increase their position in the FIFA/Coca Cola World Rankings should consider taking initiatives to improve their economic productivity, as they are likely to see an increase in their performance in international matches and competitions, and a corresponding increase in their FWR position, by doing so.
Participation rate (PR) had a much smaller, but still considerable effect, accounting for about 5% of the variance in countries’ FWR scores. Thus, perhaps the soccer governing bodies of countries wishing to improve their FWR position – especially those with low participation rates – should consider taking initiatives to increase the number of registered players playing in the amateur ranks, especially those in the younger age categories, as these players will have the greatest potential to develop into future top professional and national team players.
Rather surprisingly, population (CP) had a very low predictive value of international success. While the reasons for this low correlation are not yet fully understood, I suspect that, at least in part, it may be possible that some countries with a high population – including my home country of Canada – may have a more difficult time administering to and providing optimal coaching and development for the players within their population, thus hampering their development and subsequent performance in international competitions.
One final conclusion can be drawn from my study, and it may be the most important conclusion of all.
Despite all of the detailed analysis from my model, almost 75% of the variance in countries’ performance in the FIFA / Coca Cola World Rankings is still unaccounted for.
What is the “true” secret of success in international soccer, and will it ever be possible to measure it?
I am looking forward to continued discussion and study of this topic – here and elsewhere – in the hopes of eventually finding out!
References:
By their bootstraps. (2018). The Economist, June 9th, 2018 (51-53).